Increased summer rainfall in the Mohawk watershed
Water quality, flooding, and ecosystems are affected by more warm-month rain in the Mohawk Watershed
The fifth US National Climate Assessment (NCA5), which was released in November 2023, is a primary product of the US Global Change Research program that emerged from the Global Change Research Act of 1990 [1]. NCA5, and the four reports before that, are largely aimed at mitigation, adaptation, and building resilience [2,3,4,5]. All five reports include a section on the Northeast (US). Some of the key messages for the Northeast have been consistent since NCA1 was released in 2000, but some have not. Bear in mind that the “Northeast” in the NCA reports is a large area: it extends from West Virginia to Maine and it includes both coastal and inland settings. But an important consideration here is how the local hydrology in the Mohawk Watershed is changing as we consider mitigation, adaptation, and utilization.
This Note considers the message in NCA5 in the context of changes in the hydrology in the Mohawk Watershed (NY) that have already occurred and are ongoing. To do this we will take a look at changes in precipitation and in discharge of the Mohawk and its major tributaries. In this analysis we will see that there has been a major increase in warm-month precipitation that occurs everywhere in the watershed but this change is especially profound in Catskill-draining tributaries. This increase in warm-month precipitation has important implications for water quality, ecosystem health, drinking water resources, sediment mobility, and hydropower. The precipitation change we are seeing differs slightly from the central message in NCA5, and thus we are reminded that a local analysis is critical for planners focussed on building resilience and ecosystem services in a time of change.
An increase in precipitation has resulted in greater discharge in streams and rivers in the Mohawk watershed, especially in the summer and fall [6, 7,8,9,10]. This increase reflects recognized trends in the increase of precipitation and discharge regionally in the Northeast [5, 6]. Associated with the increase in precipitation has been an increase in extreme precipitation events, which are those events that are well outside the normal range of total precipitation in a given amount of time (commonly inches in 24 hours) [11,12,13,14]. There are also societal impacts because this increase in precipitation affects water quality, flooding, municipal water supplies, and infrastructure.
There is, however, disagreement in the literature as to the exact timing and mechanisms that drive both total precipitation increases and the extreme precipitation [see 4,5]. Thus it is useful to look at the change that has already occurred on a watershed scale because this is where impacts are most acutely felt and where management decisions are made. But first let’s look at how the Northeast is viewed in the National Climate assessment reports.
National Climate Assessment (NCA) in the Northeast. If we take a look at the National Climate Assessments in the context of watershed hydrology in the Northeast, we see a few common themes in the five successive reports regarding precipitation. Earlier reports appear to have focussed on anticipated change, and more recent reports highlight ongoing and observed change. I read through each assessment for the Northeast, and extracted what I thought were the key messages about precipitation in this region.
The first two reports anticipated warming winters and increases in heavy precipitation. NCA1 (2000) had three key messages that stand out in anticipating a future in which we can expect: 1) an increase of rain-on-snow events or rapid snow-melting events that affect flooding; 2) less common winter snowfall and less common extreme cold; and 3) an increase in heavy precipitation and overall warming [2, p. 42]. The primary message was similar in NCA2 (2009), which noted that there had been an increase in heavy precipitation, there had been less snow and more rain in the winter, and there had been an earlier breakup and snow melt in the spring [3].
The next two reports suggested that regionally extreme precipitation was still increasing but that summer and/or fall precipitation was anticipated to be near normal. NCA3 (2014), which followed hurricane Irene, highlighted recent increases in extreme precipitation, which was then greater than any other region in the US (it still is). In the future, precipitation was expected to increase in the winter and the spring, especially in the northern part of this region (which includes New York), and the frequency of heavy downpours (rainfall) was expected to continue to increase. Changes in summer and fall precipitation were expected to continue to be small and comparable to what we would expect with natural variation [4]. NCA4 (2019) indicated that there had been an increase in rainfall intensity, and there was expected to be an increase in total precipitation in the winter and spring, but not in the summer. As discussed below, the increase in summer discharge in the Mohawk watershed was already apparent at this time [A,B,C]. A message in NCA4 is worth highlighting because it may have guided decisions about resiliency: “...increases in precipitation expected during the winter and spring with little change in the summer” [4] (p. 684). And “..late summer warming, could lead to decreases in the minimum streamflows in the late summer and early fall by mid-century.” [5]
NCA5 (2023) highlights extreme weather - especially extreme rainfall - which is a central theme relevant to watershed hydrology in the Northeast [10]. This report notes that precipitation in the Northeast has increased in all seasons, and extreme precipitation events (those with a 1% annual probability) have increased by 60% (still the largest increase in the US). Part of this change may be ascribed to tropical systems, especially in the late summer and early fall [1]
Mohawk Watershed. The Mohawk Watershed, which is the largest tributary to the Hudson River, is in eastern NY, and it sits in the inland part of the “Northeast” US (as defined in the NCA reports). It consists of the main branch of the Mohawk River, two major tributaries that account for 40% of the total annual flow, and innumerable smaller tributaries. These tributaries are the West Canada Creek and the Schoharie Creek, which, despite the name, are small rivers (“creek” in this part of the Northeast has historically been used for small rivers, and it is much larger that what is commonly referred to as stream).
Precipitation is driven by typical frontal systems that can be affected by moisture from the Great Lakes (to the west), and moisture from the Atlantic Ocean (to the east and south) [15]. The increase in rainfall has been especially pronounced in the warmer months, mainly June to October, and extreme rainfall events are increasing as well. So in this Note we look at the change that has already occurred in the watershed because this is where impacts are most acutely felt, and where management decisions are made. A key question is how this warm-month increase affects a whole spectrum of ecosystem services and hazards including flooding, water quality, hydropower, drinking water, and aquatic ecosystems. This Note first explores the key data and observations - rainfall and discharge - that have been observed using 20- and 30-yr time windows. It then examines the implication of this warm-month change. The change in winter months, which are warmer with less ice, are not covered here, but are explored in this post [16].
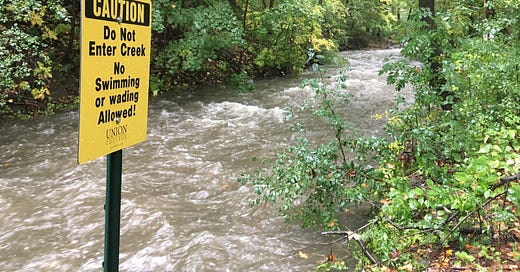
Urban streams can receive sewage and other pollutants during heavy rainfall. This is the Hans Groot Kill in Schenectady, which is impaired by leaky sanitary sewers, and contamination is especially acute at high flow (JI Garver, 7 Oct 2023).
DATA
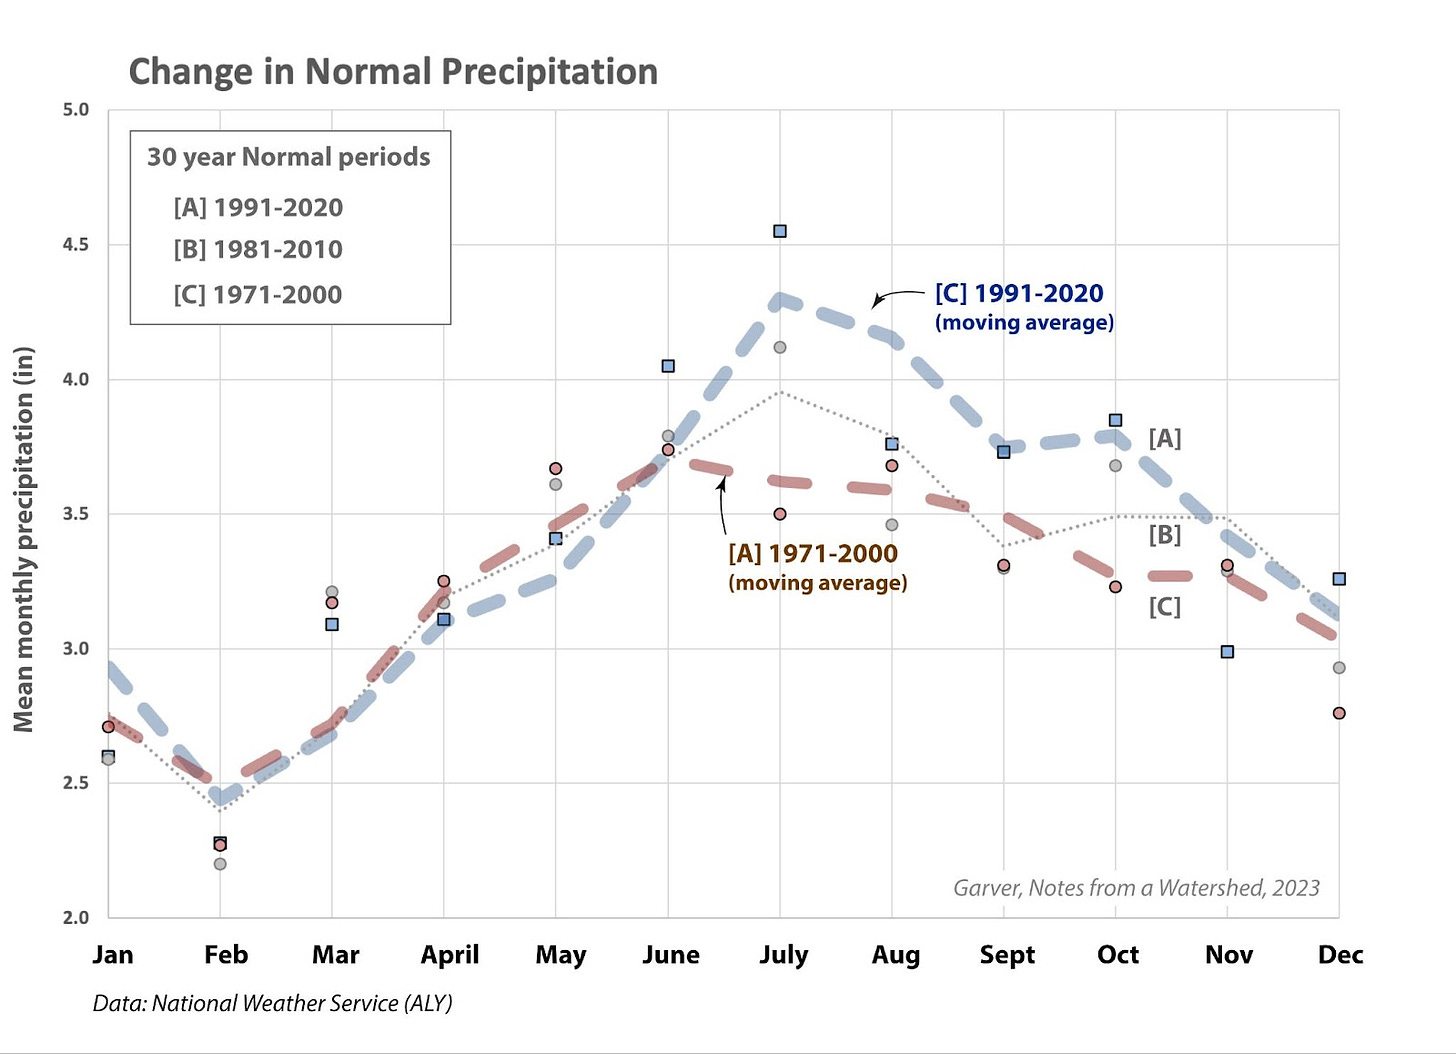
1) Precipitation. We start with what is most familiar, and that is the normal trends used in typical day-to-day weather analyses by the National Weather Service (NWS). The NWS calculates “Normal” climate parameters, such as temperature and precipitation, based on a 30-yr moving window, and it recalculates Normal values every decade. Ours were recalculated in 2020, and the 1991-2020 window is that we use today. This is a reasonable approach because it only uses the last 30 years - as opposed to the entire record that extends back for more than a century - and thus the Normal precipitation is based on more recent observations. This is a good method, especially if the system is changing and the climate today is different than in the past.
In a data time-series like precipitation, stationarity is the assumption that the statistical properties do not change over time. The Normal calculation done by the NWS allows for change and effectively builds change into the analysis. If a process is non-stationary it changes over time, so the entire record of data may not be relevant to the current and ongoing situation. Most traditional floodplain analysis and flood insurance maps assume stationarity - although there are new approaches that attempt to change this approach [17]. So if rainfall and discharge are increasing, the assumption of stationarity works against us in floodplain analysis because it will underestimate the true flood hazard. As noted above, our current Normal window is 1991 to 2020 (see data for Albany NY here) [18]. Let’s take a look at the change in precipitation in Albany, which sits in the very lowest part of the Mohawk watershed.
Data from the National Weather Service shows that precipitation is increasing in Albany, and most of that increase in the last three to four decades has occurred in the warm months. The plot below shows monthly precipitation for three partially overlapping Normal periods: 1) 1971-2000; 2) 1981-2010; and 3) 1991-2020 (see the data here). If we look at the change of every month over the entire year, we see that the warm summer months (June to October) have seen average monthly precipitation increase by about +0.50 inches per month, while winter and spring months (Nov to May) have barely changed (average monthly change is -0.06” per month). Of course this is just one station and it is located near the confluence of the Mohawk and Hudson rivers. What really matters for the entire Mohawk Watershed is how precipitation may be changing everywhere, including subtle but important changes that may be occurring in the more mountainous terrain of the Catskill Mountains, which are adjacent to the Atlantic Ocean, and the Adirondack Mountains, which are adjacent to Lake Ontario.
Average monthly precipitation in 30-year Normal periods in Albany NY as determined by the NWS. Shown here are monthly means for each normal period, and also a moving average (dotted/dashed line) between months. The increase between the early period (1971 to 2000) and the most recent period (1991-2020) has an average of 0.50 inches for warm months.
Sites along the axis of the Mohawk Valley also show an increase in warm-month rainfall. Plummer and Garver (2023) analyzed climate records of nine stations along the length of the Mohawk Valley with measurements that extend back to 1945 [15]. They showed that the most significant increases in precipitation have occurred in early spring, summer, and fall (biggest change in JJASO) and that autumn and spring precipitation regimes are shifting to more rain instead of snow. Finally they showed that the biggest change in temperature since 1945 was in the winter and early spring (DJFM) as compared to the warm months (JJAS), and that in these two cohorts, winter temperatures are warming about 1.5 times faster than these warm months [15]. A key point here is that the increase in precipitation in the watershed is mainly in the warm months.
2) Warm-month discharge of rivers It stands to reason that if there is more precipitation, then the rivers have more flow or discharge. Discharge is a little more complicated than simply comparing to precipitation amounts because water can be lost due to evaporation, transpiration by plants, groundwater recharge, and withdrawal and use by society, mainly as municipal water. Despite these caveats, we see that the mean daily discharge has increased significantly in the Mohawk and primary tributaries in warm months.
To get a picture of this change, let’s look at the record of mean daily discharge for Schoharie Creek, which flows north out of the Catskill Mountains and into the Mohawk at Fort Hunter; and then for West Canada Creek, which flows south out of the western Adirondacks into the upper Mohawk River at Herkimer. Finally we will look at the discharge record of the Mohawk River itself as measured at Cohoes Falls, near the confluence with the Hudson River.
We focus on the two biggest tributaries to the Mohawk because they are perfectly positioned to capture change that may be affecting different sources of precipitation in Upstate New York, and each accounts for about 20% of the annual flow of the Mohawk. West Canada Creek is affected by lake-effect precipitation (mainly from Lake Ontario), and Schoharie Creek is close to the Atlantic Ocean and therefore is more affected by tropical storms and other systems that are fueled by Atlantic moisture.
These two tributaries (and the Mohawk) have been monitored for discharge, near their confluence with the Mohawk, by the USGS for decades. Schoharie Creek has the shortest record, extending back only to 1939; part of this monitoring effort was related to understanding discharge of tributaries used for the NYC water supply. So, to keep the following comparison even, let’s consider two 20-year intervals, 1939-1959 and 2003-2023 (i.e. the first and last two decades available for both records). These time slices are representative of the profound change that has occurred in our watershed in the last century.
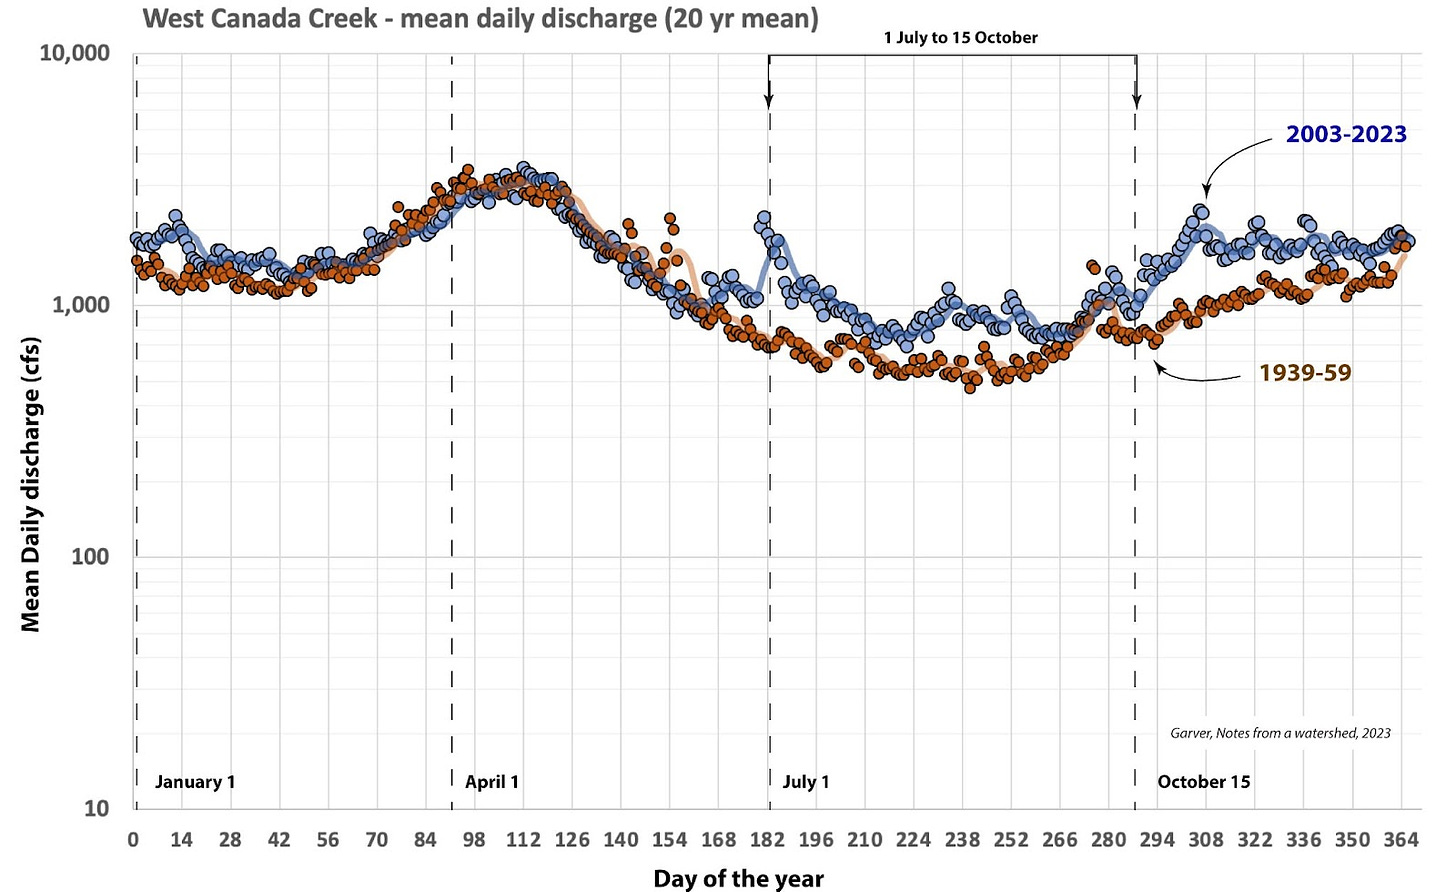
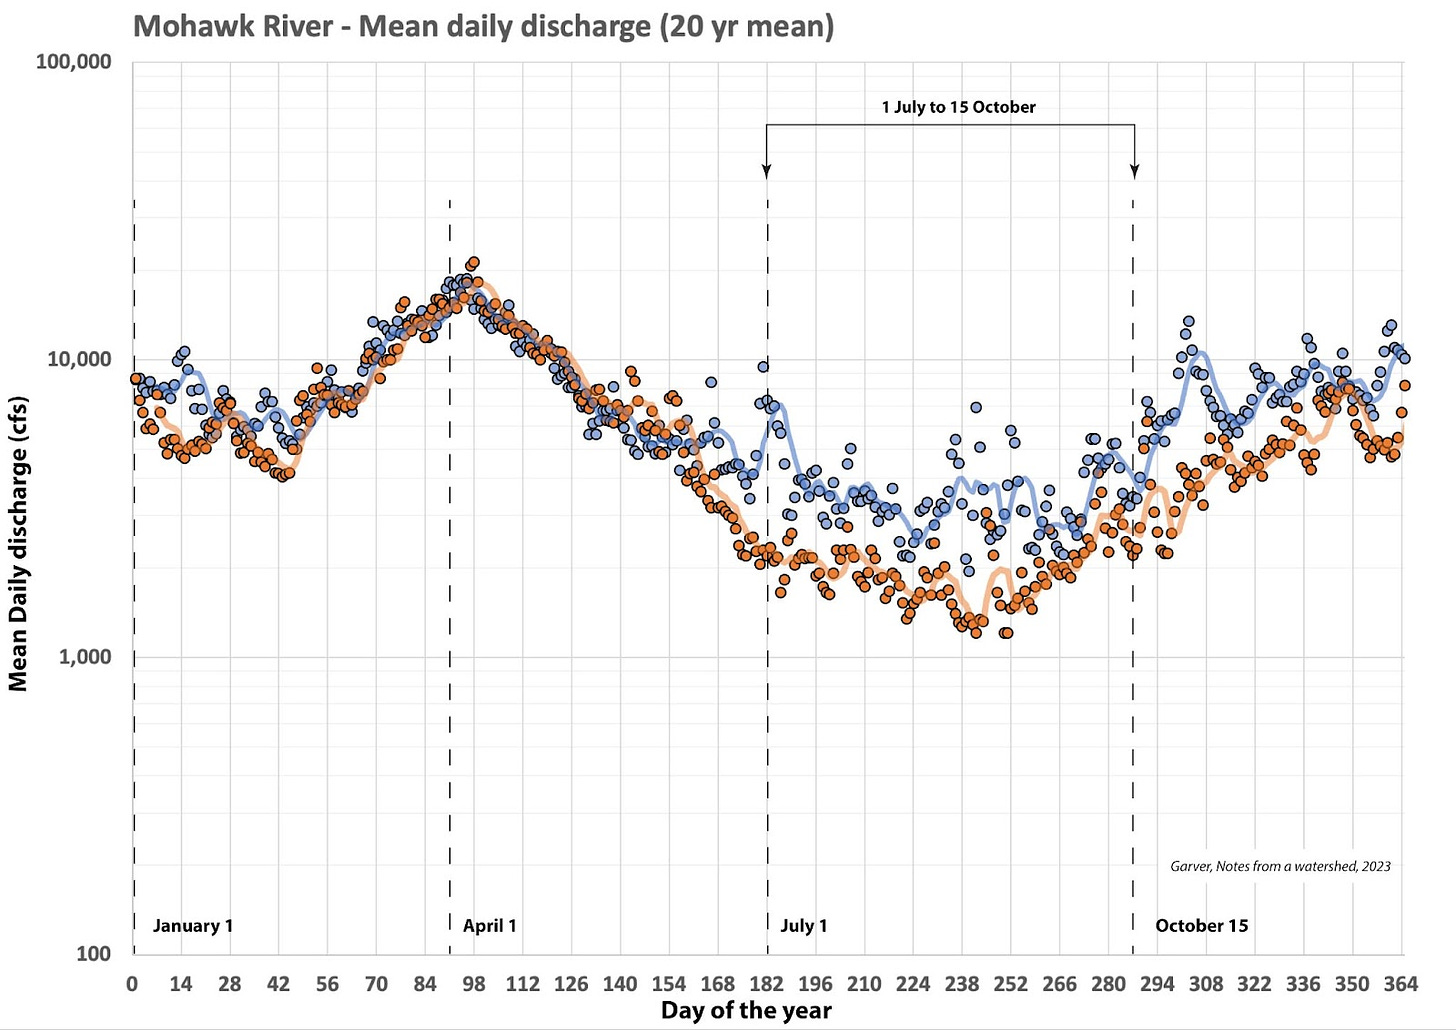
West Canada Creek. The change in discharge in West Canada Creek has been significant. If we take the mean daily discharge for every day of the year, multiply by time, and calculate the theoretical total annual volume, we get ~41 billion cubic feet (bcf) for 1939-1959, and 49 bcf for 2003-2023. This is an increase in total annual volume of about 1.2 times (spread out over the entire year), but an increase of total warm-month volume of 1.5 times. Between 1 July and 15 October, the mean daily discharge (Q or flow rate) for 1939-1959 was 661 cubic feet per second (cfs) and for 2003-2023 it was 962 cfs - about 1.5 times greater than the earlier interval. As can be seen on the diagram, these higher flows continue into the early winter.
Mean daily discharge on the West Canada Creek for the two time intervals. This and the plot of the Schoharie Creek (below) use the same logarithmic scale on the y-axis to ease comparison. (data: USGS Kast Bridge).
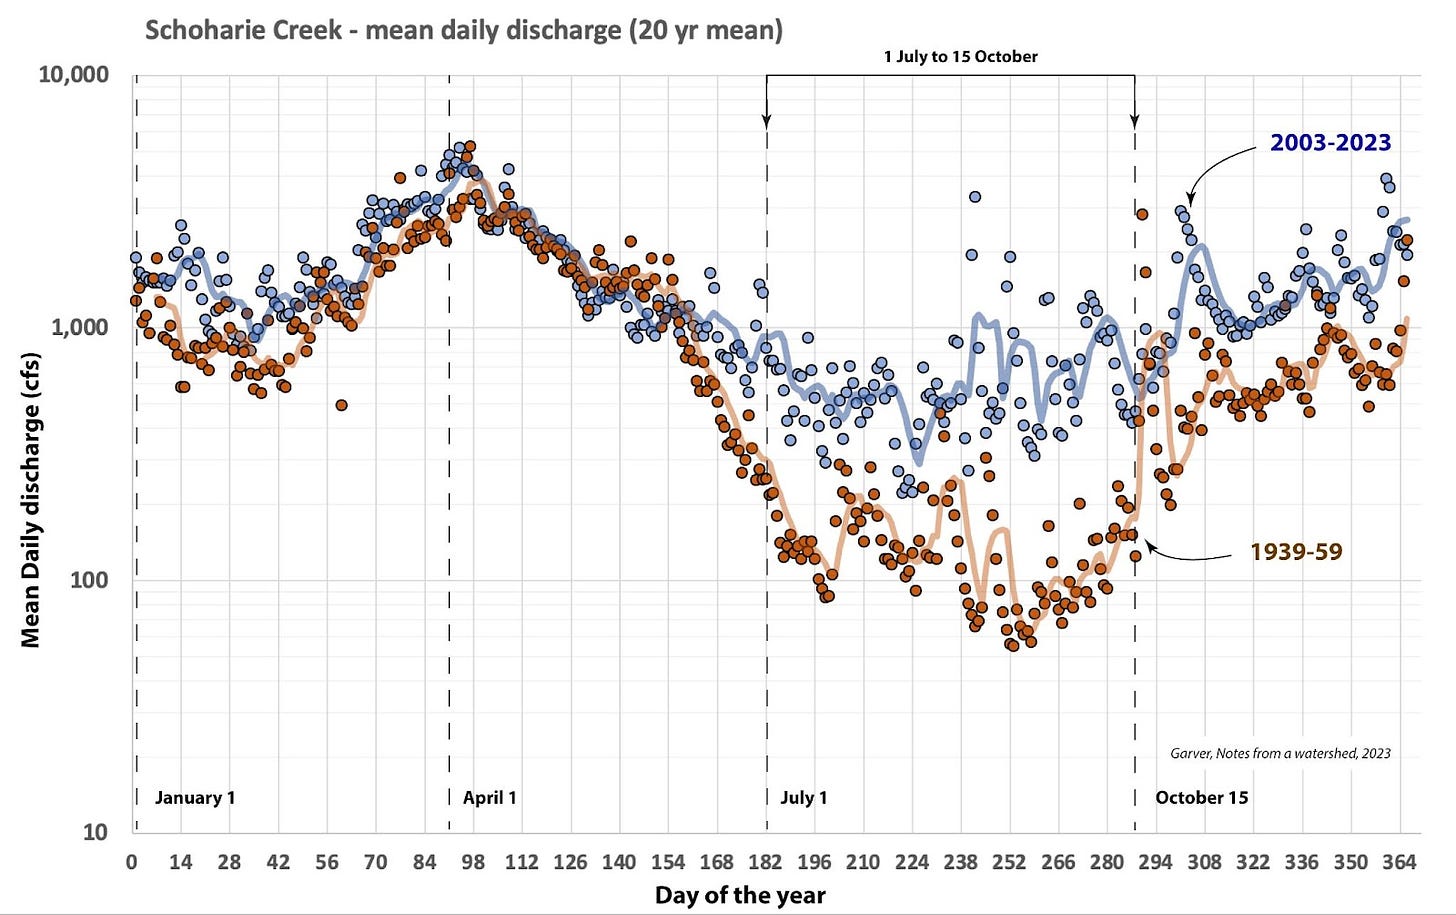
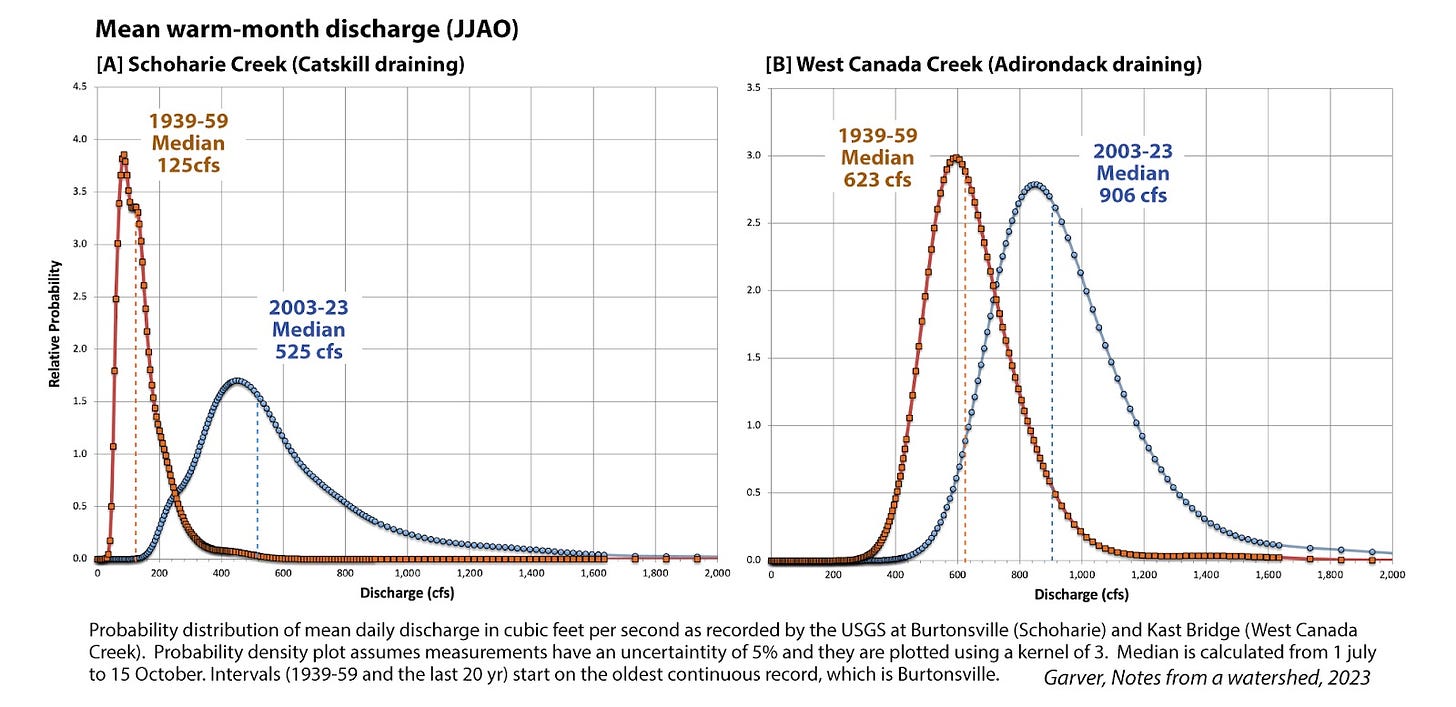
Schoharie Creek. The change in Schoharie Creek, which drains the northern Catskills, is more remarkable. If we take the mean daily discharge for every day of the year and calculate the theoretical total annual volume, we get 30 billion cubic feet (bcf) in the first time interval (1939-1959), and 47 bcf for 2003-2023, which is an increase of about 1.5 times (again, spread out over the entire year), but the increase in the volume of water in the warm months has increased by 4.6 times. Between 1 July and 15 October, the mean daily discharge in the first interval was 142 cfs (1939-1959) and in the last interval was 647 cfs (2003-2023), also about 4.6 times greater than the earlier interval. The median flow of 525 cfs is 4.2 times greater than the median flow in the earlier interval, which was 125 cfs. This is an enormous change.
While part of the Schoharie watershed has been captured and is used for the NYC drinking water supply, those flows are a small fraction of this total, and have been more or less ongoing since this record began (the Shandaken tunnel and the Gilboa dam were completed by 1925-26). A key point is that this is a remarkable amount of water that supports drinking water, hydropower, agriculture, and recreational activities. Maybe too much additional water.
Mean daily discharge on the Schoharie Creek for the two time intervals. This and the plot of the West Canada Creek (above) use the same logarithmic scale on the y-axis to ease comparison. (data: USGS Schoharie Creek at Burtonsville).
Mohawk River - Main stem. There has also been change on the Mohawk River, which has a long-term monitoring site at Cohoes near the confluence with the Hudson River. If we take the mean daily discharge for every day of the year and calculate the theoretical total annual volume, we get at total of ~180 billion cubic feet (bcf) for 1939-1959, and ~223 bcf (about 1.5 cubic miles or 6.3 cubic kilometers of water) for 2003-23, an annual increase of about 1.2 times. The increase in total volume in the warm-months is 1.8 times. In the warm-month interval, the mean daily discharge (Q) in this interval was 2004 cfs (1939-59) and in the last interval it is 3603 cfs (2003-23), thus about 1.8 times greater than the earlier interval. As with the tributaries, these higher flows continue into the early winter.
Mean daily discharge on the Mohawk River measured by the USGS at Cohoes (near the confluence with the Hudson River) for the two time intervals. This plot uses a logarithmic scale on the y-axis (data: USGS Mohawk River at Cohoes).
There is another way to look at this result, and that is through the distribution of mean flow intervals over the warm-month interval of interest. To do this we can plot the mean daily flow as a histogram over time to see the distribution of flow rates. Here we can use what is essentially a moving histogram that shows the distribution of mean daily flow as a probability density function (PDF - like a histogram, but continuous, see [19]), but the effect is the same: we are looking at the distribution of mean daily discharge rates in the warm months. The take-away point from these plots is that mean daily flow has increased during warm months since the 1939-1959 interval and this increase occurs when water is needed the most for municipalities, recreation, and most aquatic ecosystems.
An important conclusion here is that there has been significant change in the amount of water in the Mohawk Watershed. We could use different twenty-year time intervals to make this point, but the last few decades have seen such dramatic change that any comparison window gives a similar result. If you look carefully at the plots above you can see that the precipitation and discharge increases do not stop exactly on 15 October (nor do they start exactly on 1 July). I used this interval because it coincides largely with the main growing season and also the primary period for navigation and recreation.
IMPLICATIONS
As we can see from the preceding discussion, the hydrology in the Mohawk watershed (and many watersheds in the Northeast) has changed significantly. A key issue for management and building resiliency is the time of year (and the mechanisms) of this change. What are the implications of this change in summer and early fall when both water demand and recreational activities are high? This increase has important implications for our communities, infrastructure, and other ecosystem services that our rivers provide. Let’s look at a few.
Recreational activities that use creeks and rivers, such as canoeing, kayaking, tubing, fishing, and boating, have expanded opportunities, which may well translate into development of water trails and other recreational opportunities along major tributaries and the main stem of the Mohawk. While water trails are established along the main stem of the Mohawk River, it is likely that new opportunities are emerging for quiet-water and white-water boating on Schoharie Creek, West Canada Creek, and other major tributaries.
Flooding, especially in smaller tributaries, is likely increasing, and this affects floodplain management and emergency services. It seems likely that flood hazard maps (i.e. maps of the base flood elevation or the water elevation of the 100 yr flood) underestimate the true flood hazard in major tributaries to the Mohawk - including the Schoharie, West Canada, and others. It is less clear what this means for the main stem of the Mohawk River, especially the lower Mohawk that historically has been dominated by ice-jam flooding. Warmer winters may mean that ice jamming is less common and of lower magnitude (see this post), and freewater flooding is emerging as a primary factor that drives hazards on the floodplain.
Aquatic ecosystems are adapting to more water in the warm months, and in some tributaries where summer means low flow and static conditions with soaring temperatures, they are probably better off. This may mean that many of the aquatic organisms, such as fish, that need optimal conditions for spawning and annual recruitment (i.e. succesfully rearing young) have seen improvement, especially in the tributaries. But while current gaging is excellent in monitoring water levels (stage and discharge), there are fewer sensors focussed on water temperature and salinity, which are important in aquatic ecosystems.
Drinking water supplies taken from rivers and reservoirs that rely on natural recharge from precipitation both benefit from this change, in part because demand for municipal water tends to be highest in the summer. Of course this is good news for NY City, which uses a large fraction of the Catskills - including the headwaters of Schoharie Creek - for the reservoirs that serve its municipal water needs. Smaller systems are also flush with water, which is good for public health and local economic development. It is likely that water-intensive industries, such as chip manufacturing, will continue to eye water-rich Upstate NY (see Wired article here) [20]. However, more water is not necessarily better water: it has been shown regionally that acute gastrointestinal illness follows in municipalities after extreme rainfall, and this is especially significant in those that derive raw municipal water from rivers [8]. This is discussed below, but overflow of sewage and leaking pipes are major concerns.
Sediment is liberated from the headwaters when extreme events erode tributaries and send cobbles, gravel, sand, and mud downstream. Eroded sediment accumulates in low, flat parts of the watershed where sediment aggradation (building upward) may cause the channels to fill and may smother existing infrastructure. This includes accumulation of sediment behind dams, and infilling that can reduce the effectiveness of bridges and culverts. A recent example in Frankfort is the aggradation in Moyer Creek, which reduced channel depth and necessitated expensive changes to the Rt 5 bridge (see “Underfit bridge in Frankfort”) [21]. The corollary to this problem is that erosion and downcutting can occur in steeper streams and river segments. Sediment infilling and sediment management is a major problem for the Canal Corporation, which is responsible for keeping the Erie Canal deep enough for navigation. Bear in mind that the eastern Erie Canal is in the Mohawk River, and this section requires complex and continuous sediment removal. In the lower part of the Mohawk sediment has accumulated behind the permanent dams to such a degree that it has impaired boating (see this post). [22]
Hydropower has been woven into the fabric of the Mohawk Watershed and almost all active projects are run-of-the-river, which means that they generate power based on natural flows. In 2011 there were six projects on the main stem of the Mohawk totaling ~90 MW, and nine on the tributaries that total ~82 MW, hence the installed capacity is ~172 MW (Besha, 2011) [23]. The Blenheim-Gilboa project on Schoharie Creek generates on-peak power, and is essentially a closed-loop battery system. It is almost certain that greater mean daily flows are welcome news for those facilities that generate power based on run-of-the-river. There is, however, a confounding problem of sediment accumulation which is especially pronounced due to extreme precipitation. So these facilities will need sediment management plans now more than ever [22]. There are also dam safety issues related to loads of sediment trapped behind these dams [24]
Erie Canal. Given the trajectory of increased warm-weather precipitation, extreme rainfall, and mobilization of sediment on top of an aging infrastructure, it seems clear that challenges lie ahead for the Erie Canal (here, the Mohawk section). Costly canal infrastructure repair and upgrades will continue to consume precious resources that could otherwise be directed to improvement and enhancements of the canal experience. Sediment management, including removal, is badly needed to keep boats from being grounded. Rebuilding after catastrophic extreme events, like Hurricane Irene, need to continue not only to fix damage, but also to make the system more resilient for the future. The Erie Canal also serves as a pathway for many damaging aquatic invasive species introduced to the Great Lakes by contaminated ballast water in international freighters, and addressing these threats to our fishery and aquatic ecosystems will also challenge canal operations [25]
Water Quality, which is commonly impaired by leaking sanitary sewers, sewer overflows, and septic systems, will continue to be degraded because the handling systems (mainly pipes) are old, overworked, underfit for the job they were built to do, and likely in need of repair. Thus heavy rainfall events and extreme rainfall events drive sewage and municipal waste into surface waters in the Mohawk Watershed and elsewhere, which is a major public health concern because this sewage drives enteric disease [14,26]. Monitoring of fecal indicator bacteria (FIB) in the warm months Mohawk by SUNY Cobleskill, SUNY Polytechnic Institute, and Riverkeeper show that there has been an increasing trend in some FIB from 2015 to 2022, and that there is a clear relationship between FIB levels in the Mohawk and precipitation events [26].
What is unknown is how this increase in sewage in our waterways from flooding and extreme rainfall has direct health effects in local communities [see 28,29]. A major part of this sort of effort will require more high-density pathogen sampling aimed at revealing vulnerable parts of our wastewater handling systems. What is needed is a better understanding of the relationship between rainfall intensity and antecedent conditions with pathogen loads in surface waters, and the effect that these loads have on public health [30,31]. Hopefully some part of the water quality surveillance network in the Mohawk Watershed can be automated to provide real-time assessment, as is being done with an innovative H2Now system in Chicago (here) [32].
Thus a primary challenge - a grand challenge - is to adapt our aging infrastructure so that it can handle more precipitation and a greater number of extreme events. An important aspect of this with respect to water quality is that we simultaneously monitor and anticipate how pathogen loading from extreme events affects public health.
This and other Notes from a Watershed are available at: https://mohawk.substack.com/
Further Reading
[1] Fifth National Climate assessment (Northeast). Whitehead, J.C., E.L. Mecray, E.D. Lane, L. Kerr, M.L. Finucane, D.R. Reidmiller, M.C. Bove, F.A. Montalto, S. O'Rourke, D.A. Zarrilli, P. Chigbu, C.C. Thornbrugh, E.N. Curchitser, J.G. Hunter, and K. Law, 2023: Ch. 21. Northeast. In: Fifth National Climate Assessment. Crimmins, A.R., C.W. Avery, D.R. Easterling, K.E. Kunkel, B.C. Stewart, and T.K. Maycock, Eds. U.S.Global Change Research Program, Washington, DC, USA. https://doi.org/10.7930/NCA5.2023.CH21
[2] First National Climate Assessment, 2000 (full report). National Assessment Synthesis Team, Climate Change Impacts on the United States: The Potential Consequences of Climate Variability and Change, US Global Change Research Program,Washington DC, 2000.
[3] Second National Climate Assessment, 2009 (full report here). Global Climate Change Impacts in the United States, Thomas R. Karl, Jerry M. Melillo, and Thomas C. Peterson, (eds.). Cambridge University Press, 2009.
[4] Third National Climate Assessment, 2014 (Northeast). Horton, R., G. Yohe, W. Easterling, R. Kates, M. Ruth, E. Sussman, A. Whelchel, D. Wolfe, and F. Lipschultz, 2014: Ch. 16: Northeast. Climate Change Impacts in the United States: The Third National Climate Assessment, J. M. Melillo, Terese (T.C.) Richmond, and G. W. Yohe, Eds., U.S. Global Change Research Program, 16-1-nn.
[5] Fourth National Climate assessment (Northeast). Dupigny-Giroux, L.A., E.L. Mecray, M.D. Lemcke-Stampone, G.A. Hodgkins, E.E. Lentz, K.E. Mills, E.D. Lane, R. Miller, D.Y. Hollinger, W.D. Solecki, G.A. Wellenius, P.E. Sheffield, A.B. MacDonald, and C. Caldwell, 2018: Northeast. In Impacts, Risks, and Adaptation in the United States: Fourth National Climate Assessment, Volume II [Reidmiller, D.R., C.W. Avery, D.R. Easterling, K.E. Kunkel, K.L.M. Lewis, T.K. Maycock, and B.C. Stewart (eds.)]. U.S. Global Change Research Program, Washington, DC, USA, pp. 669–742
[6] Collins, M.J., 2019. River flood seasonality in the Northeast United States: Characterization and trends. Hydrological Processes, 33(5), pp.687-698.
[7] Burns, D.A., Klaus, J. and McHale, M.R., 2007. Recent climate trends and implications for water resources in the Catskill Mountain region, New York, USA. Journal of Hydrology, 336 (1-2), pp.155-170.
[8] Garver, J.I. and Cockburn, J.M.H., 2012. Change in the Mohawk Watershed and vulnerability to Infrastructure. In Mohawk Watershed Symposium (pp. 12-16).
[9] Garver, J.I. and Cockburn, J.M.H., 2011. Changes in the Hydrology of the Mohawk Watershed and implications for watershed management. In Mohawk Watershed Symposium (pp. 16-21).
[10] Cockburn, J.M. and Garver, J.I., 2015. Abrupt change in runoff on the north slope of the Catskill Mountains, NY, USA: above average discharge in the last two decades. Journal of Hydrology: Regional Studies, 3, pp.199-210. (here)
[11] Huang, H., Winter, J. M., & Osterberg, E. C. (2018). Mechanisms of abrupt extreme precipitation change over the northeastern United States. Journal of Geophysical Research: Atmospheres, 123, 7179–7192. https://doi.org/10.1029/ 2017JD028136
[12] Howarth, M.E., Thorncroft, C.D. and Bosart, L.F., 2019. Changes in extreme precipitation in the northeast United States: 1979–2014. Journal of Hydrometeorology, 20(4), pp.673-689.
[13] DeGaetano, A.T., Mooers, G. and Favata, T., 2020. Temporal changes in the areal coverage of daily extreme precipitation in the Northeastern United States using high-resolution gridded data. Journal of Applied Meteorology and Climatology, 59(3), pp.551-565.
[14] Garver, J.I., 2021. Extreme Rainfall in the Northeast: It's raining a lot and our wastewater system is bursting at the seams. The resulting sewage overflows are impairing our waterways. Notes from a Watershed at Mohawk.substack.com (Here)
[15] Plummer, I, and Garver, JI. 2023. Changes in temperature and precipitation patterns in the Mohawk Watershed: implications for flooding, water quality, and ecosystem health. In Garver, J.I., Smith, J.A., and Rodak, C. 2023. Proceedings of the 2023 Mohawk Watershed Symposium, Union College, Schenectady, NY, March 17, 2023, Volume 13, p. 54-58. Note that They used nine stations in the NCEI GSOD database.
[16} Garver, JI, 2021. River ice in a shrinking cryosphere: Warmer wetter winters will reduce ice jams and change river ecology. Notes from a Watershed at Mohawk.substack.com (here).
[17] First Street Foundation. 2023. The 8th National Risk Assessment: the Precipitation Problem (summary here and the full report is here).
[18] NWS ALY Normals, including supporting information, are Here.
[19] Węglarczyk, S., 2018. Kernel density estimation and its application. In ITM web of conferences (Vol. 23, p. 00037). EDP Sciences.
[20] Heilweil, R., 19 July 2023. Want to Win a Chip War? You’re Gonna Need a Lot of Water: The US is spending billions to boost semiconductor manufacturing. For the new plants to crank out silicon chips, they need to source millions of gallons of ultrapure water. Wired magazine.
[21] Garver, JI, 2019. Underfit bridges in Frankfort: Extreme events too much for aging infrastructure. Notes from a Watershed at Mohawk.substack.com (here).
[22] Garver, J.I., 2023. Invasive Water Chestnut is choking the lower Mohawk: Explosive growth driven by sediment blocked by the Crescent Dam. Notes from a Watershed at Mohawk.substack.com (here)
[23] Besha, J.A., 2011. Hydroelectric power in the Mohawk Watershed: Past, present, and future. In Cockburn, J.M.H. and Garver, J.I., Proceedings of the 2011 Mohawk Watershed Symposium, Union College, Schenectady, NY, March 18, 2011, p. 6-8
[24] Morris, G.L., 2020. Classification of management alternatives to combat reservoir sedimentation. Water, 12(3), p.861.
[25] Reimagine the Canals Task Force Report. January 2020. Available here.
[26] Law, N.A., Brabetz, B.L., Epstein, J., Lipscomb, J., Pillitteri, S., Rodak, C., Shapley, D., Giacinto, A.J. and Restrepo, S.V., Toward a more swimmable Mohawk: Trends in water quality based on an eight-year fecal indicator bacteria (FIB) monitoring partnership.
[27] Haley, B.M., Sun, Y., Jagai, J.S., Leibler, J.H., Fulweiler, R., Ashmore, J., Wellenius, G.A. and Heiger-Bernays, W., 2023. Association between combined sewer overflow events and gastrointestinal illness in Massachusetts municipalities with and without river-sourced drinking water, 2014-2019. medRxiv, pp.2023-10.
[28] Levy, K., Smith, S.M. and Carlton, E.J., 2018. Climate change impacts on waterborne diseases: moving toward designing interventions. Current environmental health reports, 5, pp.272-282.
[29] Deshpande, A., Chang, H.H. and Levy, K., 2020. Heavy rainfall events and diarrheal diseases: the role of urban–rural geography. The American journal of tropical medicine and hygiene, 103(3), p.1043
[30] Addison‐Atkinson, W., Chen, A.S., Memon, F.A. and Chang, T.J., 2022. Modelling urban sewer flooding and quantitative microbial risk assessment: A critical review. Journal of Flood Risk Management, 15(4), p.e12844.
[31] Levy, K., Smith, S.M. and Carlton, E.J., 2018. Climate change impacts on waterborne diseases: moving toward designing interventions. Current environmental health reports, 5, pp.272-282.
[32] The H2Now Chicago Waterway monitoring uses Tryptophan-like fluorescence (TLF) that has been calibrated to measured levels of fecal coliform bacteria. The web site for H2Now is here.


Can you shed any light on effects of changes in land use and impervious area vs. precipitation rates on stream volumes?