Drones and Ice jams in the Rexford Knolls
Drones make first 3D model of an ice jam on the Mohawk.
Ice jams on the Mohawk are dramatic natural hazards that cause considerable damage, especially due to rapid backup flooding. During breakup, ice jams can form quickly as river levels rise in response to runoff from rain and melting snow. The lower Mohawk has major issues with ice jams especially upstream from the Vischer Ferry dam at Lock 7. When jams form in this part of the river, the ice can block the river and cause backup flooding.
The historic Stockade District is one place along the river where this hazard causes considerable damage, and there is an active FEMA-funded program to address this flooding. To address ice jam floods we need to better understand the science behind ice jams. From this initial study we wrote a short paper about our findings.
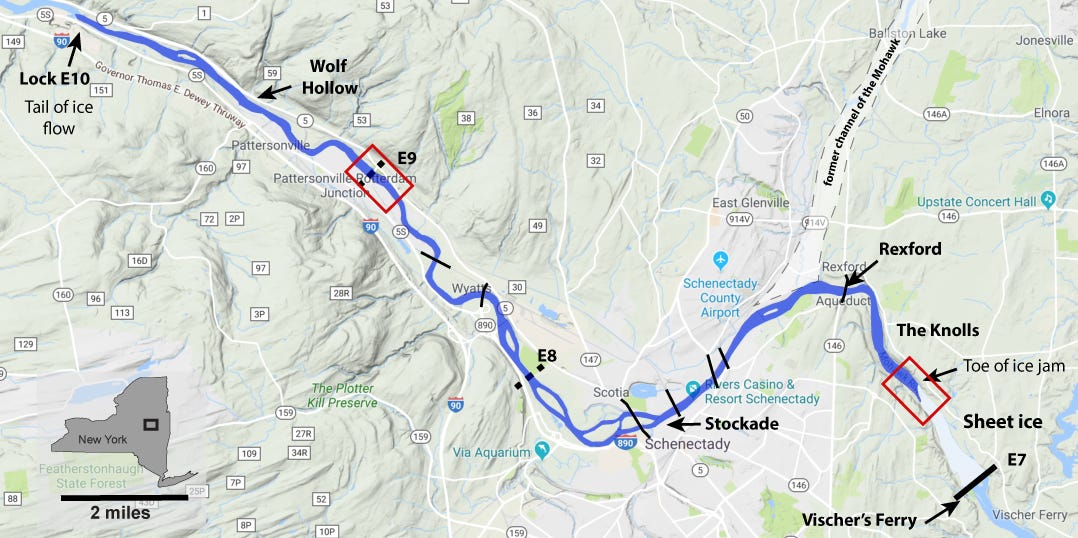
When an ice jam forms, there is an urgency to determine the jam point and the overall extent of the jam and associated flooding. The most recent major ice jam was in 2018 when the ice jammed up in the Rexford Knolls, a chronic pinch point in the River near the Vischer Ferry dam where jams form nearly annually. In the 2018 event, rubble ice behind the front or “toe” of the jam extended 17-18 miles upriver.
This was the first ice jam where drones or Unmanned Aerial Vehicles (UAV) were used extensively to map and measure ice on the Mohawk River. The effort was first lead by the Albany County Sheriff’s Drone unit and then by In Sky Aerial services (see photo below).

FAA compliant UAV (drone) flight over the ice jam at Lock E9 (Rotterdam Junction/Glenville) was done in 2018 to map ice and make a 3D digital model of ice thickness. Photo shows Ed Capovani of In Sky Aerial piloting the UAV, and the Ch. 13 News crew (Albany NY) looks on. This mapping resulted in the map showing maximum ice thickness in the location of about 15 to 18 feet (4.5 to 5.5 meters) (Photo: JI Garver).
UAVs are incredibly useful because they can get up into the air quickly and then provide a unique vantage point to evaluate the overall extent of the ice jam, and jam points. But they can collect more than just pictures and video. They can be used to collect detailed spatial data of what is essentially micro-topography, which can then be used to study ice dynamics.
Structure from Motion (SfM) is a process where detailed 3D rendering of the land or ice surface can be obtained from precisely registered 2D photographic images. That model is represented by point cloud of XYZ data points with remarkable resolution. Our goal was to make a 3D surface model of the toe (or front) of the ice jam, and then use that surface model to measure ice thickness using principles of isostacy – recall that ice floats and 10% is above water level. We can use this principal to measure ice thickness.

Map of the 2018 Ice Jam. The primary UAV mapping was done in the Knolls at the Jam Point (red box), and also at Lock 9 (also red box). The jam was 17-18 miles long, and in place for about a month.
The dynamics of ice jams are complicated. When the 2018 jam formed we were left to wonder about ice thickness and ice strength – two critical parameters needed to understand and model ice dynamics. To address this knowledge gap we turned to mapping using Unmanned Aerial Vehicles (UAV) - known to many as drones. Our mapping and subsequent model was the first UAV-measured model of ice on the Mohawk River.


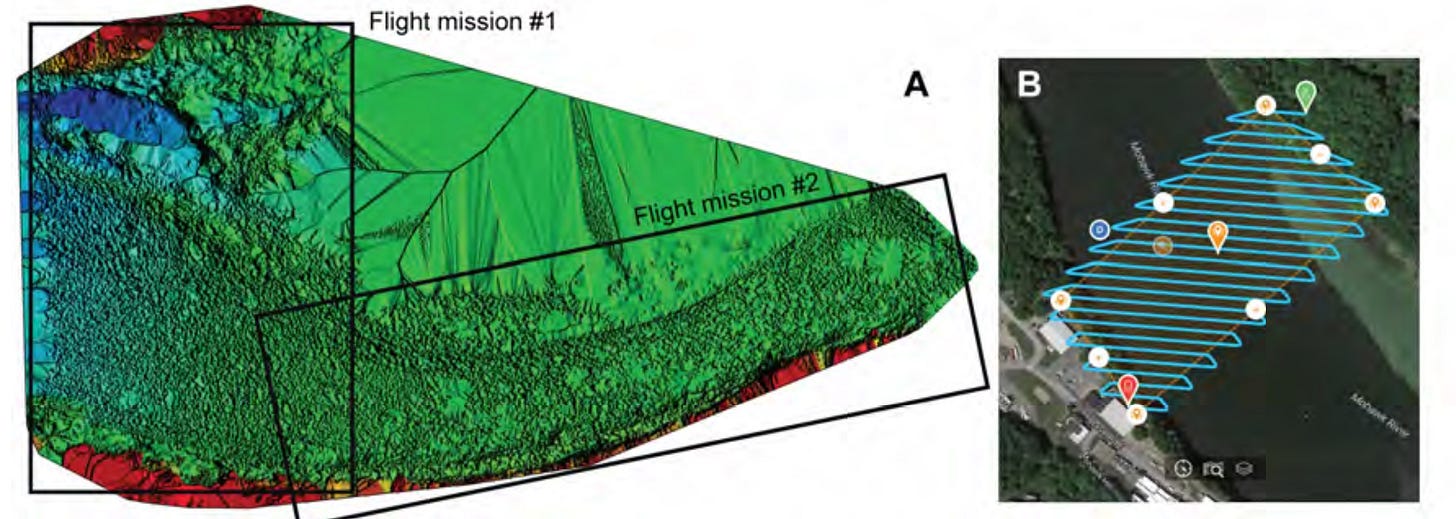
To map ice of the toe (front) of the ice jam in the Rexford Knolls we flew two flight missions where hundreds of precisely located photographs were taken of the ice surface, and then the geo-referenced photos were used to create a three dimensional model of the ice surface using PIX4D software. On the left is the Digital Surface Model (DSM) before “densification” with the general outline of the two separate flight missions used for mapping. On the right is the pre-programed flight plan for the first (west) flight used for mapping (there were two flight plans).


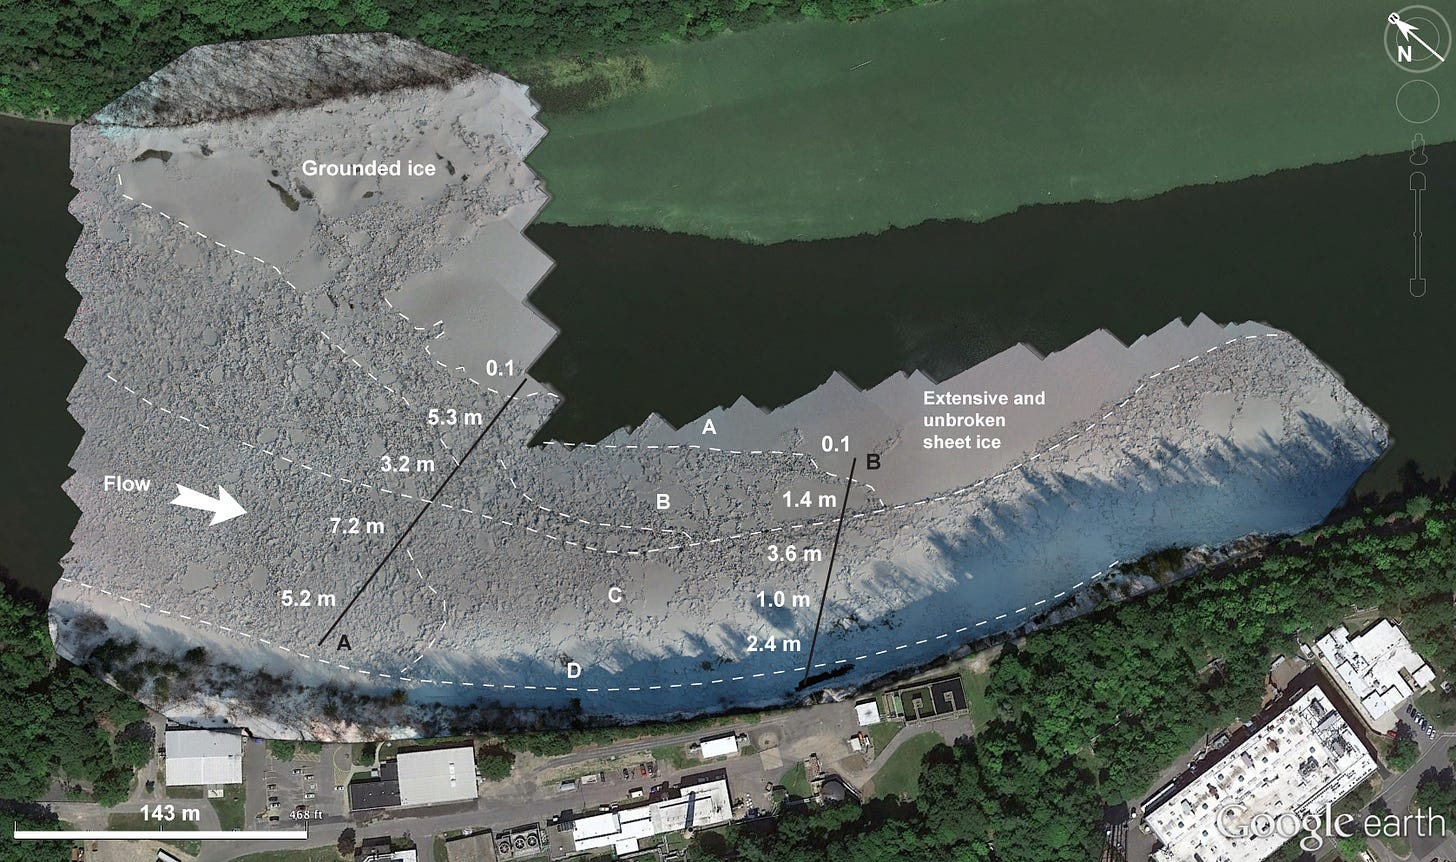
The 3D digital surface map of the toe of the 2018 ice jam in the Rexford Knolls that resulted from our mapping. The digital model is here superimposed on a Google Earth summer view of the river in front of GE Research and Development in the Knolls (Schenectady County to south, Saratoga County to north). The calculated ice thickness is shown in meters: the rubble ice at the toe has a maximum thickness of about 5 to 7 meters. Downstream to right is sheet ice and the Vischer Ferry Dam, upstream to the left is 27 kilometers of ice rubble.
Structure from Motion (SfM) photogrammetry results in an XYZ point cloud that can be manipulated and used for three-dimensional analysis – including thickness estimates provided we know the level of adjacent floating sheet ice. The two pre-programmed UAS flight paths (see diagram above for an example of one) and the geo-referenced imagery provide the basis for the model.
Once all 776 photographs were taken, the 3D model was processed using using Pix4d Mapper Pro software. The information from the images of the toe area (above) resulted in 3.2 million 3D points and this requires long computation times. The mapped area covers 0.135 km2 and includes the main part of the toe of the ice jam that formed on 13 January 2018. We flew both missions at an altitude of 46 m (152’ above ground level).
SfM allows for mapping of ice structure in the channel, and estimates of ice thickness, which were 5.2 and 7.2 meters thick (17-25 ft) – a stunning result consistent with post-event ground-based observations. Your can see the 3D model as an overflight here at InSky Aerial’s site at Youtube.
These thickness estimates are the first for ice jams on the Mohawk, and they can be used for new models that attempt to reconstruct how ice flows and jams during breakup events. This approach will allow us to better understand the hazard associated with damaging ice jams on the Mohawk.
This and other Notes from a Watershed are available at: https://mohawk.substack.com/
Garver, J.I., Capovani, E., and Pokrzwka D., 2018. Photogrammetric models from UAS mapping and ice thickness estimated of the 2018 mid-winter Ice jam on the Mohawk River, NY, In: Cockburn, J.M.H., and Garver, J.I., Proceedings from the 2018 Mohawk Watershed Symposium, Union College, Schenectady NY, 23 March 2018, v. 10, p. 19-24.

